In this article
Robustness in decentralized federated learning should be measured as a response to conditions, not as a single number detached from the experiment. A model can keep a high F1 score while communication degrades, resources saturate or one participant starts sending poisoned updates. Good evaluation makes those dimensions visible.
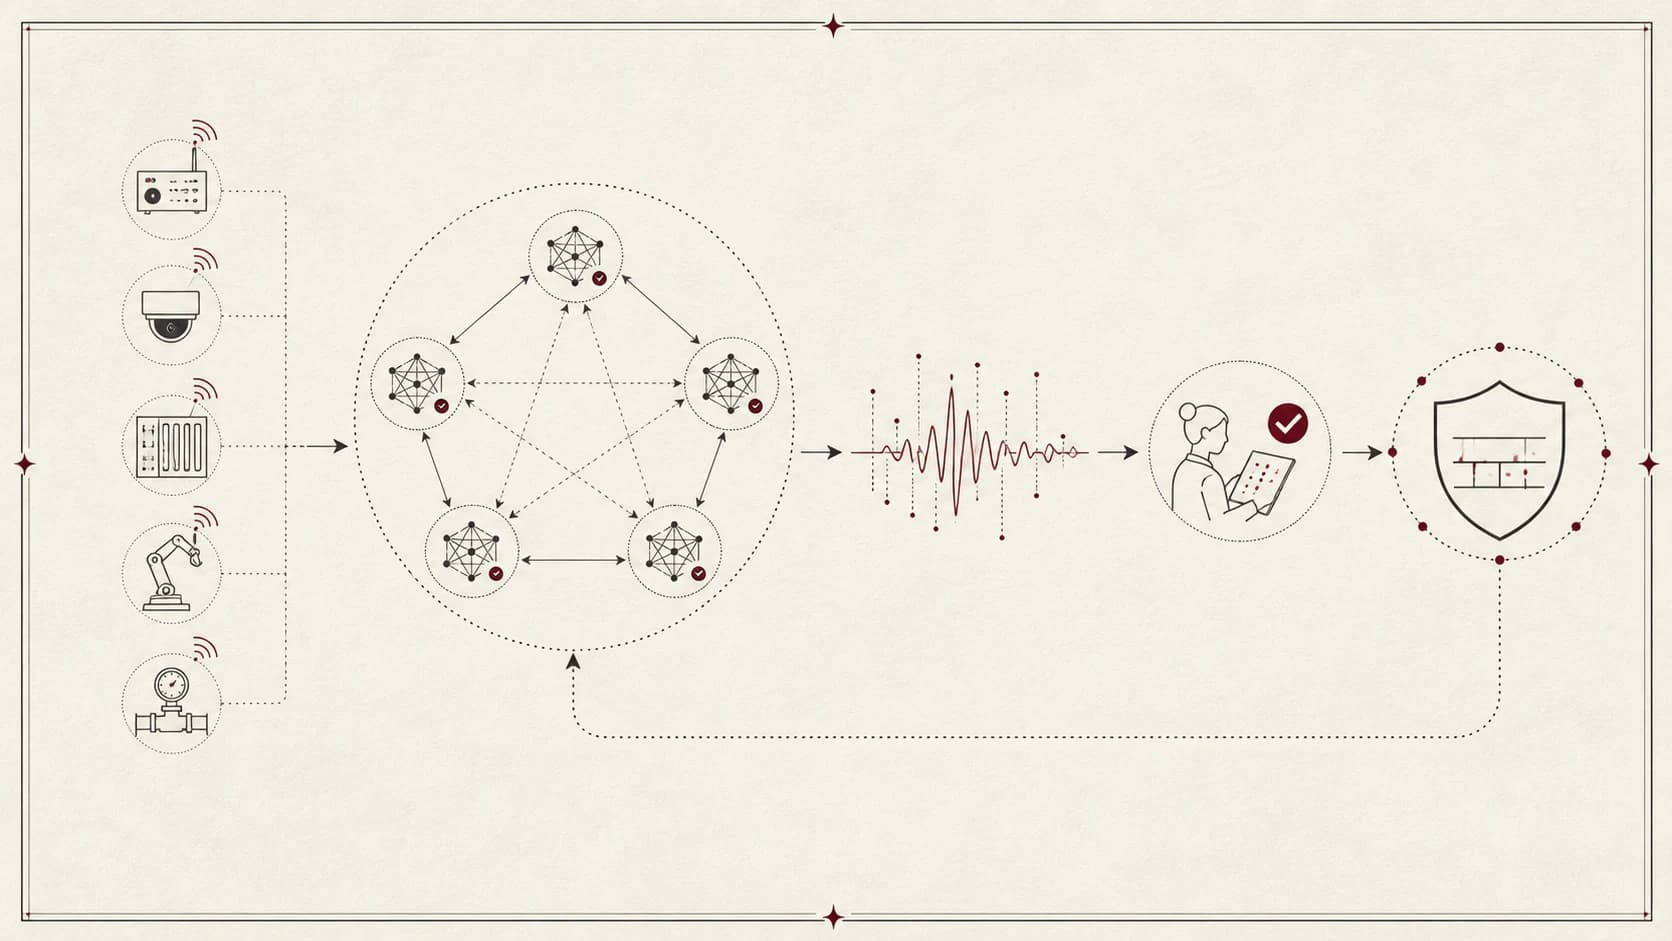
The Flighter experiments provide a useful template. Four simulated SAR-equipped aircraft collaborate on reconnaissance with VGG16, using MSTAR, SAMPLE and OpenSARShip. The scenario includes a baseline and several operational or adversarial perturbations. These results are valuable precisely because their scope is explicit.
Start with the task metrics
For a binary or one-vs-rest decision, the familiar quantities are:
If the formula does not fit, focus it and use the left and right arrows, or scroll horizontally.and:
If the formula does not fit, focus it and use the left and right arrows, or scroll horizontally.F1 is useful when false positives and false negatives both matter, but it does not describe the health of the federation. It should be read beside network and system measurements.
Establish a reproducible baseline
Under the baseline conditions reported for the three datasets, the study obtains F1 values of 95.8% for MSTAR, 97.5% for SAMPLE and 79.1% for OpenSARShip. These numbers are not a universal ranking of the datasets or a guarantee for a deployment. They are reference points for asking how much performance is lost when the environment is disturbed.
The same baseline records approximately 57% CPU use, 1.7 GB of RAM, 0.7% packet loss and a 5.3 second round time. Reporting these values prevents a misleading comparison in which a defense method appears better only because its resource cost is hidden.
Perturb the system in different ways
The thesis distinguishes several families of stress:
Context manipulation
When geopositioning is manipulated, the reported F1 values are 91.8% for MSTAR, 90.3% for SAMPLE and 72.0% for OpenSARShip. Packet loss remains below 1% in the described experiment. This case tests whether operational context can reduce the effect of a node whose behavior no longer matches the mission.
Collision-course behavior
For the collision-course manipulation, the corresponding F1 values are 92.5%, 89.8% and 70.1%. The reduction is not identical across datasets, which is a reminder that a robustness mechanism interacts with the data distribution and the task difficulty.
Poisoning
Under poisoning scenarios, F1 ranges from 52.1% to 90.1% depending on the dataset and attack configuration. A range is more informative than a single average because it shows that the same protocol can behave very differently as the local data and adversarial strategy change.
Use a measurement matrix
A compact report can combine the following axes:
| Axis | What to record | Why it matters |
|---|---|---|
| Predictive quality | F1, precision, recall and confusion matrix | Shows task-level effect |
| Collaboration | round time, message delivery and peer participation | Exposes protocol health |
| Resources | CPU, memory and energy proxy | Tests deployability |
| Robustness | poisoning, context manipulation and stale peers | Tests threat assumptions |
| Fairness | per-client or per-class performance | Detects hidden local failures |
The last row is especially important in heterogeneous settings. A global F1 can stay stable while a minority client or class loses most of its recall. Robustness should include the distribution of outcomes, not only the mean.
Interpret the result without overclaiming
Three questions make an evaluation more honest:
- What was fixed? Dataset, model, graph, number of clients and attack budget all affect the result.
- What changed? A comparison is meaningful only if the defense and baseline share the same training and communication conditions.
- What is still missing? Simulation cannot establish behavior under real sensors, real mobility, real failures or a previously unseen attack.
The Flighter study is therefore best read as a controlled demonstration of cross-layer evaluation. It connects model performance to situational signals and gives a concrete way to discuss reduced influence, connection limits and recovery. The next step is not to publish a larger percentage. It is to test whether the indicators remain useful when they are noisy, delayed or manipulated themselves.
A reusable experiment protocol
For a new DFL defense, publish:
- the clean baseline,
- the graph and client participation policy,
- the attack and perturbation model,
- predictive and systems metrics per condition,
- confidence intervals or repeated runs,
- the resource overhead of the defense,
- failure and recovery behavior.
That level of detail turns robustness from a marketing adjective into an auditable property of the system.
Absolute difference and relative improvement
An F1 change from 0.80 to 0.84 is four percentage points and a 5% relative improvement. This is arithmetic, not a Flighter result. Always state which convention a comparison uses and whether F1 is macro, micro or weighted.
The preceding figures belong to the Flighter study and its described configuration. Do not combine them with results from a different topology or budget as though the comparison were controlled.
Separate attack effects from defense costs
I propose four conditions: no attack/no defense, no attack/defense, attack/no defense and attack/defense. Use identical data partitions and seeds for paired comparisons. This separates improvements under attack from penalties in normal conditions.
Include an adversary with a declared budget and a legitimate highly heterogeneous client. Count false rejections, recovery after the attack and worst-client degradation. Excluding non-convergent runs removes precisely part of the evidence needed for robustness.
Uncertainty with independent units
Clients in one federation are not independent replicates: they share updates. Use independent runs as the unit for variability estimates, retaining per-client results for within-run analysis. Publish seeds, attack duration and stopping rules.
Yang and colleagues, ICML 2025 motivate attention to clean-data quality. Extend the experimental design with DFL limitations and open questions and Byzantine aggregation.